Welcome to the Data Interpretation MCQs Page
Dive deep into the fascinating world of Data Interpretation with our comprehensive set of Multiple-Choice Questions (MCQs). This page is dedicated to exploring the fundamental concepts and intricacies of Data Interpretation, a crucial aspect of UGC CBSE NET General Paper. In this section, you will encounter a diverse range of MCQs that cover various aspects of Data Interpretation, from the basic principles to advanced topics. Each question is thoughtfully crafted to challenge your knowledge and deepen your understanding of this critical subcategory within UGC CBSE NET General Paper.
Check out the MCQs below to embark on an enriching journey through Data Interpretation. Test your knowledge, expand your horizons, and solidify your grasp on this vital area of UGC CBSE NET General Paper.
Note: Each MCQ comes with multiple answer choices. Select the most appropriate option and test your understanding of Data Interpretation. You can click on an option to test your knowledge before viewing the solution for a MCQ. Happy learning!
Data Interpretation MCQs | Page 9 of 14
Explore more Topics under UGC CBSE NET General Paper
Measurements of some variable X were made at an interval of 1 minute from 10 A.M. to 10:20 A.M. The data, thus, obtained is as follows:
X :60, 62, 65, 64, 63, 61, 66, 65, 70, 68, 63, 62, 64, 69, 65, 64, 66, 67, 66, 64
The value of X, which is exceeded 90% of the time in the duration of measurement, is
Measurements of some variable X were made at an interval of 1 minute from 10 A.M. to 10:20 A.M. The data, thus, obtained is as follows:
X :60, 62, 65, 64, 63, 61, 66, 65, 70, 68, 63, 62, 64, 69, 65, 64, 66, 67, 66, 64
The value of X, which is exceeded 50% of the time in the duration of measurement, is
In which year, the total production of electronic items is maximum?

What is the difference between averages of production of LCDs and TVs from 2006 to 2008 ?

What is the year in which production of TVs is half the production of LCDs in the year 2010 ?
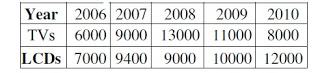
What is the ratio of production of LCDs in the years 2008 and 2010 ?

What is the ratio of production of TVs in the years 2006 and 2007 ?

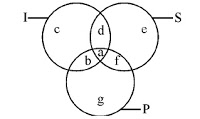
The region which represents non-Indian scientists who are politicians.

The region which represents politicians who are Indians as well as scientists.
Suggested Topics
Are you eager to expand your knowledge beyond Data Interpretation? We've curated a selection of related categories that you might find intriguing.
Click on the categories below to discover a wealth of MCQs and enrich your understanding of Computer Science. Happy exploring!

.png)