Welcome to the Data Interpretation MCQs Page
Dive deep into the fascinating world of Data Interpretation with our comprehensive set of Multiple-Choice Questions (MCQs). This page is dedicated to exploring the fundamental concepts and intricacies of Data Interpretation, a crucial aspect of UGC CBSE NET General Paper. In this section, you will encounter a diverse range of MCQs that cover various aspects of Data Interpretation, from the basic principles to advanced topics. Each question is thoughtfully crafted to challenge your knowledge and deepen your understanding of this critical subcategory within UGC CBSE NET General Paper.
Check out the MCQs below to embark on an enriching journey through Data Interpretation. Test your knowledge, expand your horizons, and solidify your grasp on this vital area of UGC CBSE NET General Paper.
Note: Each MCQ comes with multiple answer choices. Select the most appropriate option and test your understanding of Data Interpretation. You can click on an option to test your knowledge before viewing the solution for a MCQ. Happy learning!
Data Interpretation MCQs | Page 7 of 14
Explore more Topics under UGC CBSE NET General Paper
Which of the following two years have recorded the highest rate of increase in area under the total horticulture?

Shares of the area under flowers, vegetables and fruits in the area under total horticulture are respectively:
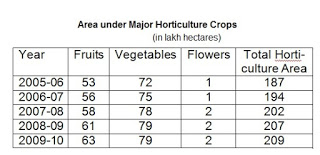
Which of the following has recorded the highest rate of increase in are during 2005-06 to 2009-10?

Find out the horticultural crop that has recorded an increase of area by around 10 percent from 2005-06 to 2009-10.

What has been the share of area under fruits, vegetables and flowers in the area under total horticulture in 2007- 08?

In which year, area under fruits has recorded the highest rate of increase?

How many activities in the social services are there where the expenditure has been less than 5 percent of the total expenditures incurred on the social services in 2008-09?

In which year, the expenditures on the social services have increased at the highest rate?
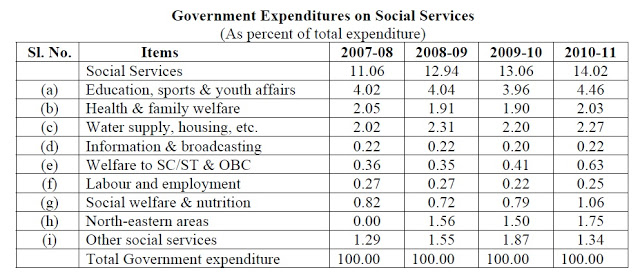
Which of the following activities remains almost stagnant in terms of share of expenditures?

Which of the following item’s expenditure share is almost equal to the remaining three items in the given years?

Suggested Topics
Are you eager to expand your knowledge beyond Data Interpretation? We've curated a selection of related categories that you might find intriguing.
Click on the categories below to discover a wealth of MCQs and enrich your understanding of Computer Science. Happy exploring!