Welcome to the Data Interpretation MCQs Page
Dive deep into the fascinating world of Data Interpretation with our comprehensive set of Multiple-Choice Questions (MCQs). This page is dedicated to exploring the fundamental concepts and intricacies of Data Interpretation, a crucial aspect of UGC CBSE NET General Paper. In this section, you will encounter a diverse range of MCQs that cover various aspects of Data Interpretation, from the basic principles to advanced topics. Each question is thoughtfully crafted to challenge your knowledge and deepen your understanding of this critical subcategory within UGC CBSE NET General Paper.
Check out the MCQs below to embark on an enriching journey through Data Interpretation. Test your knowledge, expand your horizons, and solidify your grasp on this vital area of UGC CBSE NET General Paper.
Note: Each MCQ comes with multiple answer choices. Select the most appropriate option and test your understanding of Data Interpretation. You can click on an option to test your knowledge before viewing the solution for a MCQ. Happy learning!
Data Interpretation MCQs | Page 5 of 14
Explore more Topics under UGC CBSE NET General Paper
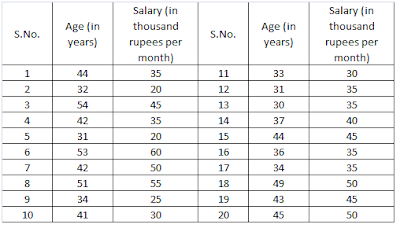
Classify the data of age of each employee in class interval of 5 years. Which class interval of 5 years has the maximum average salary?
By what percentage (%), the total emissions of CO2 have increased from 2005 to 2009?

What is the average annual growth rate of CO2 emission in power sector?
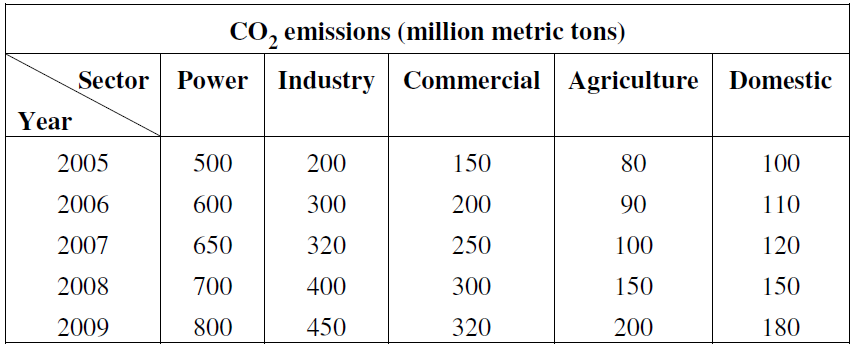

In which year, the contribution (%) of industry to total sectoral CO2 emission was minimum?

What is the percentage (%) growth of CO2 emission from power sector during 2005 to 2009?

Which sector has recorded maximum growth in CO2 emission during 2005 to 2009?

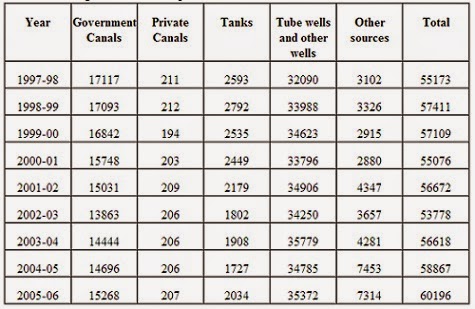
Net Area under Irrigation by sources in a country (Thousand Hectares)
Find out the source of irrigation that has registered the maximum improvement in terms of percentage of Net irrigated area during 2002-03 and 2003-04.

Net Area under Irrigation by sources in a country (Thousand Hectares)
In which of the following years, Net irrigation by tanks increased at the highest rate?
Net Area under Irrigation by sources in a country (Thousand Hectares)
Identify the source of irrigation that has recorded the maximum incidence of negative growth in terms of Net irrigated area during the years given in the table.

Suggested Topics
Are you eager to expand your knowledge beyond Data Interpretation? We've curated a selection of related categories that you might find intriguing.
Click on the categories below to discover a wealth of MCQs and enrich your understanding of Computer Science. Happy exploring!