
Welcome to the Data Interpretation MCQs Page
Dive deep into the fascinating world of Data Interpretation with our comprehensive set of Multiple-Choice Questions (MCQs). This page is dedicated to exploring the fundamental concepts and intricacies of Data Interpretation, a crucial aspect of UGC CBSE NET General Paper. In this section, you will encounter a diverse range of MCQs that cover various aspects of Data Interpretation, from the basic principles to advanced topics. Each question is thoughtfully crafted to challenge your knowledge and deepen your understanding of this critical subcategory within UGC CBSE NET General Paper.
Check out the MCQs below to embark on an enriching journey through Data Interpretation. Test your knowledge, expand your horizons, and solidify your grasp on this vital area of UGC CBSE NET General Paper.
Note: Each MCQ comes with multiple answer choices. Select the most appropriate option and test your understanding of Data Interpretation. You can click on an option to test your knowledge before viewing the solution for a MCQ. Happy learning!
Data Interpretation MCQs | Page 6 of 14
Explore more Topics under UGC CBSE NET General Paper
Net Area under Irrigation by sources in a country (Thousand Hectares)
In which of the following years, share of the tube wells and other wells in the total net irrigated area was the highest?
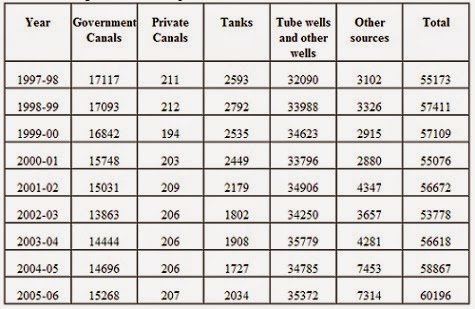
Net Area under Irrigation by sources in a country (Thousand Hectares)
Which of the following sources of Irrigation has registered the largest percentage of decline in Net area under irrigation during 1997-98 and 2005-06 ?

Find out the region that contributed around 20 percent of the total foreign tourist arrivals in India in 2009.
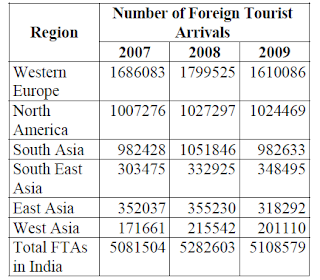
Which of the following regions has recorded the highest negative growth rate of foreign tourist arrivals in India in 2009 ?

Find out the region that has been showing declining trend in terms of share of foreign tourist arrivals in India in 2008 and 2009.

Identify the region that has shown hyper growth rate of foreign tourist arrivals than the growth rate of the total FTAs in India in 2008.

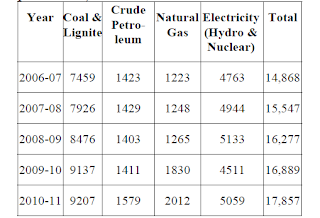
In which year primary sources recorded the lowest growth in total production of energy ?

Which source of energy has shown the highest growth rate in production during 2006-07 to 2010-11 ?

Which one of the following primary sources of energy has recorded the highest growth in production in 2008–09 ?

Suggested Topics
Are you eager to expand your knowledge beyond Data Interpretation? We've curated a selection of related categories that you might find intriguing.
Click on the categories below to discover a wealth of MCQs and enrich your understanding of Computer Science. Happy exploring!


.png)