Welcome to the Data Interpretation MCQs Page
Dive deep into the fascinating world of Data Interpretation with our comprehensive set of Multiple-Choice Questions (MCQs). This page is dedicated to exploring the fundamental concepts and intricacies of Data Interpretation, a crucial aspect of UGC CBSE NET General Paper. In this section, you will encounter a diverse range of MCQs that cover various aspects of Data Interpretation, from the basic principles to advanced topics. Each question is thoughtfully crafted to challenge your knowledge and deepen your understanding of this critical subcategory within UGC CBSE NET General Paper.
Check out the MCQs below to embark on an enriching journey through Data Interpretation. Test your knowledge, expand your horizons, and solidify your grasp on this vital area of UGC CBSE NET General Paper.
Note: Each MCQ comes with multiple answer choices. Select the most appropriate option and test your understanding of Data Interpretation. You can click on an option to test your knowledge before viewing the solution for a MCQ. Happy learning!
Data Interpretation MCQs | Page 12 of 14
Explore more Topics under UGC CBSE NET General Paper
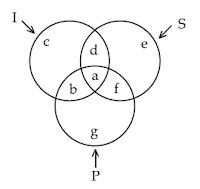
Different regions in the figure are lettered from a to f.
The region which represents Indians who are neither Scientists nor Politicians:

Different regions in the figure are lettered from a to f.
The region which represents Politicians who are Indians as well as Scientists:
In the year 2000, which of the following Companies earned maximum percent profit ?

In the year 2001, which of the following Companies earned minimum percent profit ?
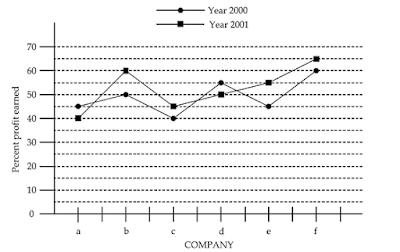
In the years 2000 and 2001, which of the following Companies earned maximum average percent profit ?

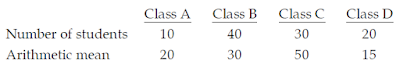
The combined mean of the marks of four classes together will be :
Suggested Topics
Are you eager to expand your knowledge beyond Data Interpretation? We've curated a selection of related categories that you might find intriguing.
Click on the categories below to discover a wealth of MCQs and enrich your understanding of Computer Science. Happy exploring!