Welcome to the Data Interpretation MCQs Page
Dive deep into the fascinating world of Data Interpretation with our comprehensive set of Multiple-Choice Questions (MCQs). This page is dedicated to exploring the fundamental concepts and intricacies of Data Interpretation, a crucial aspect of UGC CBSE NET General Paper. In this section, you will encounter a diverse range of MCQs that cover various aspects of Data Interpretation, from the basic principles to advanced topics. Each question is thoughtfully crafted to challenge your knowledge and deepen your understanding of this critical subcategory within UGC CBSE NET General Paper.
Check out the MCQs below to embark on an enriching journey through Data Interpretation. Test your knowledge, expand your horizons, and solidify your grasp on this vital area of UGC CBSE NET General Paper.
Note: Each MCQ comes with multiple answer choices. Select the most appropriate option and test your understanding of Data Interpretation. You can click on an option to test your knowledge before viewing the solution for a MCQ. Happy learning!
Data Interpretation MCQs | Page 10 of 14
Explore more Topics under UGC CBSE NET General Paper
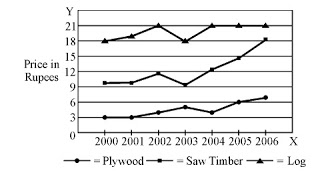
Which product shows the maximum percentage increase in price over the period?

What is the maximum percentage increase in price per cubic metre of log?

In which year the prices of two products increased and that of the third increased?
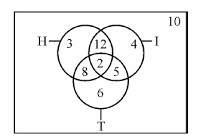
How many persons would be reading at least two newspapers?

How many persons would be reading almost two newspapers?
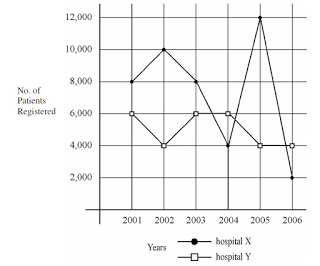
In which year total number of patients registered in hospital X and hospital Y was the maximum?
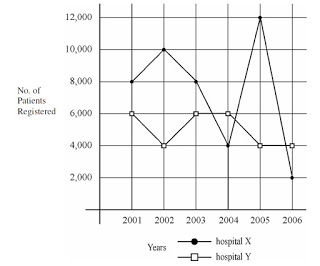
What is the maximum dispersion in the registration of patients in the two hospitals in a year?

In which year there was maximum decrease in registration of patients in hospital X?
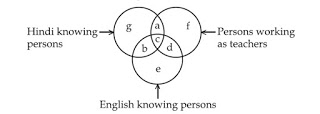
If you want to select Hindi and English knowing teachers, which of the following is to be selected?
Suggested Topics
Are you eager to expand your knowledge beyond Data Interpretation? We've curated a selection of related categories that you might find intriguing.
Click on the categories below to discover a wealth of MCQs and enrich your understanding of Computer Science. Happy exploring!