Welcome to the Data Interpretation MCQs Page
Dive deep into the fascinating world of Data Interpretation with our comprehensive set of Multiple-Choice Questions (MCQs). This page is dedicated to exploring the fundamental concepts and intricacies of Data Interpretation, a crucial aspect of UGC CBSE NET General Paper. In this section, you will encounter a diverse range of MCQs that cover various aspects of Data Interpretation, from the basic principles to advanced topics. Each question is thoughtfully crafted to challenge your knowledge and deepen your understanding of this critical subcategory within UGC CBSE NET General Paper.
Check out the MCQs below to embark on an enriching journey through Data Interpretation. Test your knowledge, expand your horizons, and solidify your grasp on this vital area of UGC CBSE NET General Paper.
Note: Each MCQ comes with multiple answer choices. Select the most appropriate option and test your understanding of Data Interpretation. You can click on an option to test your knowledge before viewing the solution for a MCQ. Happy learning!
Data Interpretation MCQs | Page 4 of 14
Explore more Topics under UGC CBSE NET General Paper
Based on the average decadal growth rate, what will be the population in the year 2021?

In the year 1951, what was the power availability per person?

In which decade, the average power availability per person was maximum?
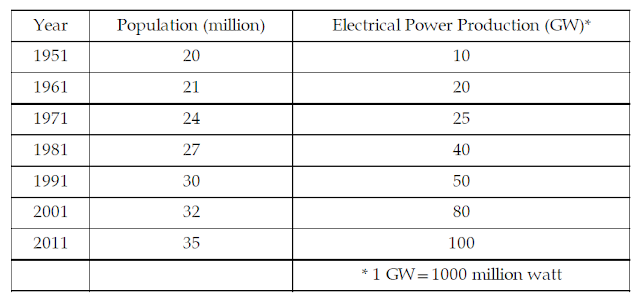
By what percentage (%) the power production increased from 1951 o 2011?

passed in all five subjects = 5583
passed in three subjects only = 1400
passed in two subjects only = 1200
passed in one subject only 735
failed in English only = 75
failed in Physics only = 145
failed in Chemistry only = 140
failed in Mathematics only = 200
failed in Bio-science only = 157
The number of students passed in at least four subjects is:
What is the average salary (in thousand per month) in the age group 40-50 years?

What is the fraction of employees getting salary less than the average salary of all the employees?

What is the frequency (%) in the class interval of 30-35 years?
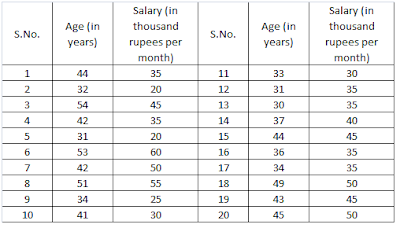
What is the fraction (%) of employees getting salary ≥ 40,000 per month?

What is the average age of the employees?

Suggested Topics
Are you eager to expand your knowledge beyond Data Interpretation? We've curated a selection of related categories that you might find intriguing.
Click on the categories below to discover a wealth of MCQs and enrich your understanding of Computer Science. Happy exploring!