Welcome to the Data Interpretation MCQs Page
Dive deep into the fascinating world of Data Interpretation with our comprehensive set of Multiple-Choice Questions (MCQs). This page is dedicated to exploring the fundamental concepts and intricacies of Data Interpretation, a crucial aspect of UGC CBSE NET General Paper. In this section, you will encounter a diverse range of MCQs that cover various aspects of Data Interpretation, from the basic principles to advanced topics. Each question is thoughtfully crafted to challenge your knowledge and deepen your understanding of this critical subcategory within UGC CBSE NET General Paper.
Check out the MCQs below to embark on an enriching journey through Data Interpretation. Test your knowledge, expand your horizons, and solidify your grasp on this vital area of UGC CBSE NET General Paper.
Note: Each MCQ comes with multiple answer choices. Select the most appropriate option and test your understanding of Data Interpretation. You can click on an option to test your knowledge before viewing the solution for a MCQ. Happy learning!
Data Interpretation MCQs | Page 11 of 14
Explore more Topics under UGC CBSE NET General Paper
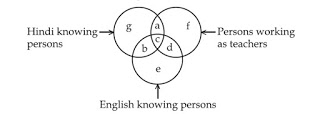
If you want to select persons, who do not know English and are not teachers, which of the region is to be selected?
In which year the quantity of engineering goods' exports was maximum?
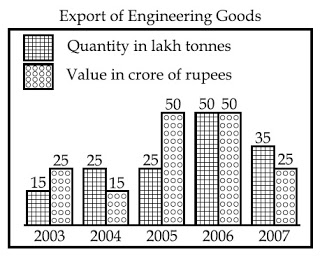

In which year the quantity of exports was 100 percent higher than the quantity of previous year?

Some Graduates are Government employees but not as Clerks.
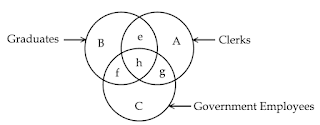
Clerks who are graduates as well as government employees:

Some graduates are Clerks but not Government employees.

Which of the firms got maximum profit growth rate in the year 2006?
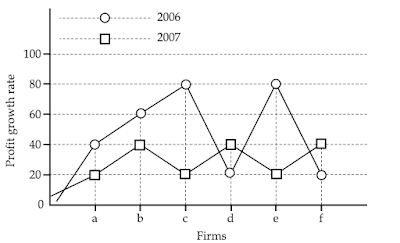
Which of the firms got maximum profit growth rate in the year 2007?

Different regions in the figure are lettered from a to f.
The region which represents Non-Indian Scientists who are Politicians:

Suggested Topics
Are you eager to expand your knowledge beyond Data Interpretation? We've curated a selection of related categories that you might find intriguing.
Click on the categories below to discover a wealth of MCQs and enrich your understanding of Computer Science. Happy exploring!