Welcome to the Data Interpretation MCQs Page
Dive deep into the fascinating world of Data Interpretation with our comprehensive set of Multiple-Choice Questions (MCQs). This page is dedicated to exploring the fundamental concepts and intricacies of Data Interpretation, a crucial aspect of UGC CBSE NET General Paper. In this section, you will encounter a diverse range of MCQs that cover various aspects of Data Interpretation, from the basic principles to advanced topics. Each question is thoughtfully crafted to challenge your knowledge and deepen your understanding of this critical subcategory within UGC CBSE NET General Paper.
Check out the MCQs below to embark on an enriching journey through Data Interpretation. Test your knowledge, expand your horizons, and solidify your grasp on this vital area of UGC CBSE NET General Paper.
Note: Each MCQ comes with multiple answer choices. Select the most appropriate option and test your understanding of Data Interpretation. You can click on an option to test your knowledge before viewing the solution for a MCQ. Happy learning!
Data Interpretation MCQs | Page 13 of 14
Explore more Topics under UGC CBSE NET General Paper
The ratio of the total expenditure on football to that of expenditure on hockey is:

If the total expenditure on sports during the year was Rs. 1,20,000,00 how much was spent on basket ball?

The chart shows that the most popular game of the country is :

Out of the following country's expenditure is the same on :
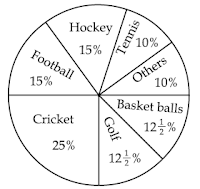
If the total expenditure on sport during the year was Rs. 1,50,00,000 the expenditure on cricket and hockey together was:

In which year the value per tin was minimum?

What was the difference between the tins exported in 1997 and 1998?
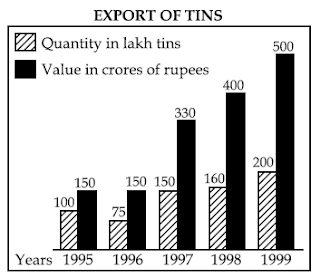
What was the approximate percentage increase in export value from 1995 to 1999?

What was the percentage drop in export quantity from 1995 to 1996?

If in 1998, the tins were exported at the same rate per tin as that in 1997, what would be the value (in crores of rupees) of export in 1998?

Suggested Topics
Are you eager to expand your knowledge beyond Data Interpretation? We've curated a selection of related categories that you might find intriguing.
Click on the categories below to discover a wealth of MCQs and enrich your understanding of Computer Science. Happy exploring!