Welcome to the Data Interpretation MCQs Page
Dive deep into the fascinating world of Data Interpretation with our comprehensive set of Multiple-Choice Questions (MCQs). This page is dedicated to exploring the fundamental concepts and intricacies of Data Interpretation, a crucial aspect of UGC CBSE NET General Paper. In this section, you will encounter a diverse range of MCQs that cover various aspects of Data Interpretation, from the basic principles to advanced topics. Each question is thoughtfully crafted to challenge your knowledge and deepen your understanding of this critical subcategory within UGC CBSE NET General Paper.
Check out the MCQs below to embark on an enriching journey through Data Interpretation. Test your knowledge, expand your horizons, and solidify your grasp on this vital area of UGC CBSE NET General Paper.
Note: Each MCQ comes with multiple answer choices. Select the most appropriate option and test your understanding of Data Interpretation. You can click on an option to test your knowledge before viewing the solution for a MCQ. Happy learning!
Data Interpretation MCQs | Page 8 of 14
Explore more Topics under UGC CBSE NET General Paper
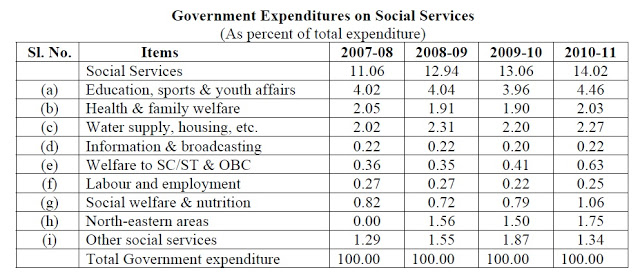
Which of the following items of social services has registered the highest rate of increase in expenditures during 2007-08 to 2010-11?

Which of the following items has registered the highest rate of decline in terms of expenditure during 2007-08 to 2009-10?
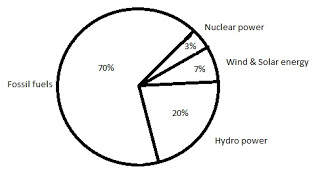
What is the contribution of wind and solar power in absolute terms in the electricity generation?

What is the contribution of renewable energy sources in absolute terms in the electricity generation?
What is the absolute CO2 emission from domestic sector?
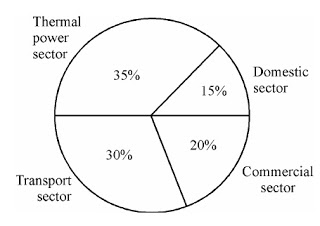
What is the absolute CO2 emission for combined thermal power and transport sectors?

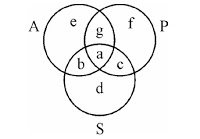
Different regions in the figure are lettered from a to f:
The region which represents artists who are neither sportsmen nor professors.
Different regions in the figure are lettered from a to f:
The region which represents professors, who are both artists and sportspersons.

Different regions in the figure are lettered from a to f:
The region which represents professors, who are also sportspersons, but not artists.

Measurements of some variable X were made at an interval of 1 minute from 10 A.M. to 10:20 A.M. The data, thus, obtained is as follows:
X :60, 62, 65, 64, 63, 61, 66, 65, 70, 68, 63, 62, 64, 69, 65, 64, 66, 67, 66, 64
The value of X, which is exceeded 10% of the time in the duration of measurement, is
Suggested Topics
Are you eager to expand your knowledge beyond Data Interpretation? We've curated a selection of related categories that you might find intriguing.
Click on the categories below to discover a wealth of MCQs and enrich your understanding of Computer Science. Happy exploring!


.png)


.png)