Welcome to the Data Interpretation MCQs Page
Dive deep into the fascinating world of Data Interpretation with our comprehensive set of Multiple-Choice Questions (MCQs). This page is dedicated to exploring the fundamental concepts and intricacies of Data Interpretation, a crucial aspect of UGC CBSE NET General Paper. In this section, you will encounter a diverse range of MCQs that cover various aspects of Data Interpretation, from the basic principles to advanced topics. Each question is thoughtfully crafted to challenge your knowledge and deepen your understanding of this critical subcategory within UGC CBSE NET General Paper.
Check out the MCQs below to embark on an enriching journey through Data Interpretation. Test your knowledge, expand your horizons, and solidify your grasp on this vital area of UGC CBSE NET General Paper.
Note: Each MCQ comes with multiple answer choices. Select the most appropriate option and test your understanding of Data Interpretation. You can click on an option to test your knowledge before viewing the solution for a MCQ. Happy learning!
Data Interpretation MCQs | Page 3 of 14
Explore more Topics under UGC CBSE NET General Paper
What is the percentage of vegetarian students in class MCA-I ?
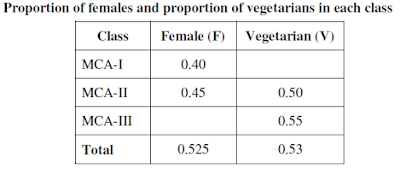
How many total non-vegetarian students are there in class MCA-I and class MCA-II ?

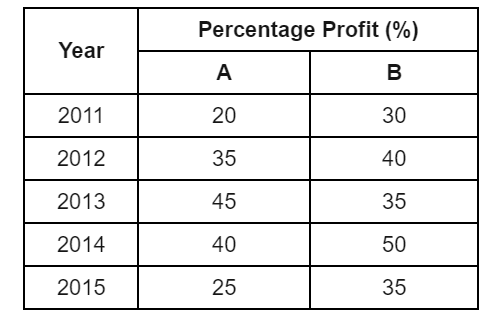
2011-15. Answer the following question based on the data contained in the table. (Where, percent (%) Profit = (Income-Expenditure) × 100/Expenditure)
If the total expenditure of the two companies was Rs.9 lakh in the year 2012 and the expenditure of A and B were in the ratio2:1, then what was the income of the company A in that year?
2011-15. Answer the following question based on the data contained in the table. (Where, percent (%) Profit = (Income-Expenditure) × 100/Expenditure)
What is the average percentage profit earned by the company B?

2011-15. Answer the following question based on the data contained in the table. (Where, percent (%) Profit = (Income-Expenditure) × 100/Expenditure)
In which year, the percentage profit earned by the company B is less than that of company A?

Approximately what percentage of the total sample were aged 21-30?
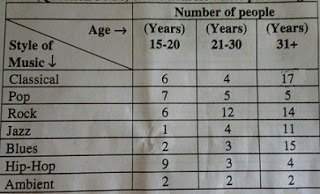
Approximately what percentage of the total sample indicates that Hip-Hop is their favourite style of music?

What percentage of respondents aged 31+ indicated a favourite style other than classical music?

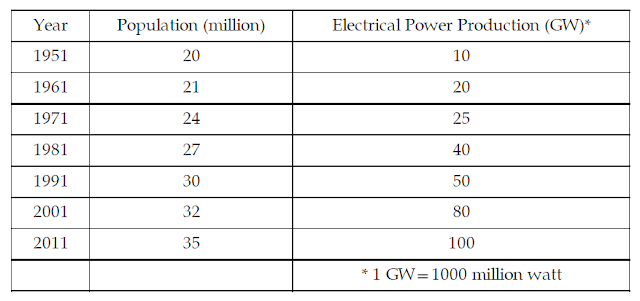
Which decade registered the maximum growth rate (%) of population?

Average decadal growth rate (%) of population is:
Suggested Topics
Are you eager to expand your knowledge beyond Data Interpretation? We've curated a selection of related categories that you might find intriguing.
Click on the categories below to discover a wealth of MCQs and enrich your understanding of Computer Science. Happy exploring!