Question
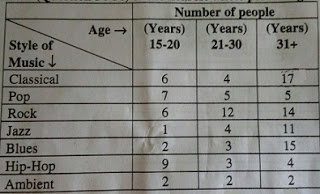
Approximately what percentage of the total sample indicates that Hip-Hop is their favourite style of music?
a.
6%
b.
8%
c.
14%
d.
12%
Posted under UGC NET general paper Data Interpretation
Engage with the Community - Add Your Comment
Confused About the Answer? Ask for Details Here.
Know the Explanation? Add it Here.
Q. The following table shows the number of people in different age groups who responded to a survey about their favourite style of music. Use this information to answer the question...
Similar Questions
Discover Related MCQs
Q. The following table shows the number of people in different age groups who responded to a survey about their favourite style of music. Use this information to answer the question that follow to the nearest whole percentage.
What percentage of respondents aged 31+ indicated a favourite style other than classical music?
View solution
Q. Given below in the table is the decadal data of Population and Electrical Power Production of a country. Based on the table data, answer the question that follow.
Which decade registered the maximum growth rate (%) of population?
View solution
Q. Given below in the table is the decadal data of Population and Electrical Power Production of a country. Based on the table data, answer the question that follow.
Average decadal growth rate (%) of population is:
View solution
Q. Given below in the table is the decadal data of Population and Electrical Power Production of a country. Based on the table data, answer the question that follow.
Based on the average decadal growth rate, what will be the population in the year 2021?
View solution
Q. Given below in the table is the decadal data of Population and Electrical Power Production of a country. Based on the table data, answer the question that follow.
In the year 1951, what was the power availability per person?
View solution
Q. Given below in the table is the decadal data of Population and Electrical Power Production of a country. Based on the table data, answer the question that follow.
In which decade, the average power availability per person was maximum?
View solution
Q. Given below in the table is the decadal data of Population and Electrical Power Production of a country. Based on the table data, answer the question that follow.
By what percentage (%) the power production increased from 1951 o 2011?
View solution
Q. In an examination 10,000 students appeared. The result revealed the number of students who have:
passed in all five subjects = 5583
passed in three subjects only = 1400
passed in two subjects only = 1200
passed in one subject only 735
failed in English only = 75
failed in Physics only = 145
failed in Chemistry only = 140
failed in Mathematics only = 200
failed in Bio-science only = 157
The number of students passed in at least four subjects is:
View solution
Q. A company has 20 employees with their age (in years) and salary (in thousand rupees per month) mentioned against each of them. The following question is based on the tabulated data given below:
What is the average salary (in thousand per month) in the age group 40-50 years?
View solution
Q. A company has 20 employees with their age (in years) and salary (in thousand rupees per month) mentioned against each of them. The following question is based on the tabulated data given below:
What is the fraction of employees getting salary less than the average salary of all the employees?
View solution
Q. A company has 20 employees with their age (in years) and salary (in thousand rupees per month) mentioned against each of them. The following question is based on the tabulated data given below:
What is the frequency (%) in the class interval of 30-35 years?
View solution
Q. A company has 20 employees with their age (in years) and salary (in thousand rupees per month) mentioned against each of them. The following question is based on the tabulated data given below:
What is the fraction (%) of employees getting salary ≥ 40,000 per month?
View solution
Q. A company has 20 employees with their age (in years) and salary (in thousand rupees per month) mentioned against each of them. The following question is based on the tabulated data given below:
What is the average age of the employees?
View solution
Q. A company has 20 employees with their age (in years) and salary (in thousand rupees per month) mentioned against each of them. The following question is based on the tabulated data given below:
Classify the data of age of each employee in class interval of 5 years. Which class interval of 5 years has the maximum average salary?
View solution
Q. For a county CO2 emissions (million metric tons) from various sectors are given in the following table. Answer the question that follow on the basis of data given.
By what percentage (%), the total emissions of CO2 have increased from 2005 to 2009?
View solution
Q. For a county CO2 emissions (million metric tons) from various sectors are given in the following table. Answer the question that follow on the basis of data given.
What is the average annual growth rate of CO2 emission in power sector?
View solution
Q. What is the percentage contribution of power sector to total CO2 emission in the year 2008?
View solution
Q. For a county CO2 emissions (million metric tons) from various sectors are given in the following table. Answer the question that follow on the basis of data given.
In which year, the contribution (%) of industry to total sectoral CO2 emission was minimum?
View solution
Q. For a county CO2 emissions (million metric tons) from various sectors are given in the following table. Answer the question that follow on the basis of data given.
What is the percentage (%) growth of CO2 emission from power sector during 2005 to 2009?
View solution
Q. For a county CO2 emissions (million metric tons) from various sectors are given in the following table. Answer the question that follow on the basis of data given.
Which sector has recorded maximum growth in CO2 emission during 2005 to 2009?
View solution
Suggested Topics
Are you eager to expand your knowledge beyond Data Interpretation? We've curated a selection of related categories that you might find intriguing.
Click on the categories below to discover a wealth of MCQs and enrich your understanding of Computer Science. Happy exploring!