Question
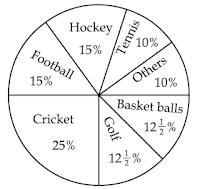
If the total expenditure on sports during the year was Rs. 1,20,000,00 how much was spent on basket ball?
a.
Rs. 9,50,000
b.
Rs. 10,00,000
c.
Rs. 12,00,000
d.
Rs. 15,00,000
Posted under UGC NET general paper Data Interpretation
Engage with the Community - Add Your Comment
Confused About the Answer? Ask for Details Here.
Know the Explanation? Add it Here.
Q. The following pie chart indicates the expenditure of a country on various sports during a particular year. Study the pie chart and answer the question below. If the total...
Similar Questions
Discover Related MCQs
Q. The following pie chart indicates the expenditure of a country on various sports during a particular year. Study the pie chart and answer the question below.
The chart shows that the most popular game of the country is :
View solution
Q. The following pie chart indicates the expenditure of a country on various sports during a particular year. Study the pie chart and answer the question below.
Out of the following country's expenditure is the same on :
View solution
Q. The following pie chart indicates the expenditure of a country on various sports during a particular year. Study the pie chart and answer the question below.
If the total expenditure on sport during the year was Rs. 1,50,00,000 the expenditure on cricket and hockey together was:
View solution
Q. Study the following graph carefully and answer the question given below:
In which year the value per tin was minimum?
View solution
Q. Study the following graph carefully and answer the question given below:
What was the difference between the tins exported in 1997 and 1998?
View solution
Q. Study the following graph carefully and answer the question given below:
What was the approximate percentage increase in export value from 1995 to 1999?
View solution
Q. Study the following graph carefully and answer the question given below:
What was the percentage drop in export quantity from 1995 to 1996?
View solution
Q. Study the following graph carefully and answer the question given below:
If in 1998, the tins were exported at the same rate per tin as that in 1997, what would be the value (in crores of rupees) of export in 1998?
View solution
Q. Study the following graph and answer the question below:
In which year was the sale of ‘Pep-up’ the maximum ?
View solution
Q. Study the following graph and answer the question below:
In the case of which soft drink was the average annual sale maximum during the period 1988 - 1993.
View solution
Q. Study the following graph and answer the question below:
What was the approximate percent drop in the sale of Pep - up in 1990 over its sale in 1989 ?
View solution
Q. The number of students in two classes A and B and the respective “mean” of the marks obtained by each of the class are given in the following table :
Class A Class B
Number of Students 20 80
Arithmetic Mean 10 20
The combined “mean” of the marks of the two classes will be :
View solution
Suggested Topics
Are you eager to expand your knowledge beyond Data Interpretation? We've curated a selection of related categories that you might find intriguing.
Click on the categories below to discover a wealth of MCQs and enrich your understanding of Computer Science. Happy exploring!


.png)