Question
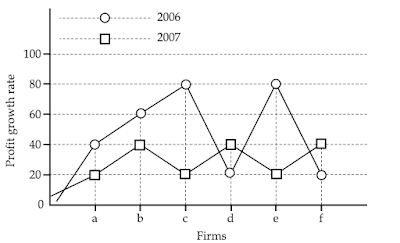
Which of the firms got maximum profit growth rate in the year 2006?
a.
ab
b.
ce
c.
cd
d.
ef
Posted under UGC NET general paper Data Interpretation
Engage with the Community - Add Your Comment
Confused About the Answer? Ask for Details Here.
Know the Explanation? Add it Here.
Q. Study the following graph and answer question below: Which of the firms got maximum profit growth rate in the year 2006?
Similar Questions
Discover Related MCQs
Q. Study the following graph and answer question below:
Which of the firms got maximum profit growth rate in the year 2007?
View solution
Q. The below question is based on the following diagram in which there are three interlocking circles I, S and P, where circle I stands for Indians, circle S for Scientists and circle P for Politicians.
Different regions in the figure are lettered from a to f.
The region which represents Non-Indian Scientists who are Politicians:
View solution
Q. The below question is based on the following diagram in which there are three interlocking circles I, S and P, where circle I stands for Indians, circle S for Scientists and circle P for Politicians.
Different regions in the figure are lettered from a to f.
The region which represents Indians who are neither Scientists nor Politicians:
View solution
Q. The below question is based on the following diagram in which there are three interlocking circles I, S and P, where circle I stands for Indians, circle S for Scientists and circle P for Politicians.
Different regions in the figure are lettered from a to f.
The region which represents Politicians who are Indians as well as Scientists:
View solution
Q. Which of the following methods will you choose to prepare choropleth map of India showing urban density of population:
View solution
Q. Which of the following methods is best suited to show on a map the types of crops being grown in a region:
View solution
Q. A ratio represents the relation between:
View solution
Q. Circle graphs are used to show:
View solution
Q. Study the following graph and answer the question below:
In the year 2000, which of the following Companies earned maximum percent profit ?
View solution
Q. Study the following graph and answer the question below:
In the year 2001, which of the following Companies earned minimum percent profit ?
View solution
Q. Study the following graph and answer the question below:
In the years 2000 and 2001, which of the following Companies earned maximum average percent profit ?
View solution
Q. The number of students in four classes A, B, C, D and their respective mean marks obtained by each of the class are given below :
The combined mean of the marks of four classes together will be :
View solution
Q. The following pie chart indicates the expenditure of a country on various sports during a particular year. Study the pie chart and answer the question below.
The ratio of the total expenditure on football to that of expenditure on hockey is:
View solution
Q. The following pie chart indicates the expenditure of a country on various sports during a particular year. Study the pie chart and answer the question below.
If the total expenditure on sports during the year was Rs. 1,20,000,00 how much was spent on basket ball?
View solution
Q. The following pie chart indicates the expenditure of a country on various sports during a particular year. Study the pie chart and answer the question below.
The chart shows that the most popular game of the country is :
View solution
Q. The following pie chart indicates the expenditure of a country on various sports during a particular year. Study the pie chart and answer the question below.
Out of the following country's expenditure is the same on :
View solution
Q. The following pie chart indicates the expenditure of a country on various sports during a particular year. Study the pie chart and answer the question below.
If the total expenditure on sport during the year was Rs. 1,50,00,000 the expenditure on cricket and hockey together was:
View solution
Q. Study the following graph carefully and answer the question given below:
In which year the value per tin was minimum?
View solution
Q. Study the following graph carefully and answer the question given below:
What was the difference between the tins exported in 1997 and 1998?
View solution
Q. Study the following graph carefully and answer the question given below:
What was the approximate percentage increase in export value from 1995 to 1999?
View solution
Suggested Topics
Are you eager to expand your knowledge beyond Data Interpretation? We've curated a selection of related categories that you might find intriguing.
Click on the categories below to discover a wealth of MCQs and enrich your understanding of Computer Science. Happy exploring!