Welcome to the Data Interpretation MCQs Page
Dive deep into the fascinating world of Data Interpretation with our comprehensive set of Multiple-Choice Questions (MCQs). This page is dedicated to exploring the fundamental concepts and intricacies of Data Interpretation, a crucial aspect of UGC CBSE NET General Paper. In this section, you will encounter a diverse range of MCQs that cover various aspects of Data Interpretation, from the basic principles to advanced topics. Each question is thoughtfully crafted to challenge your knowledge and deepen your understanding of this critical subcategory within UGC CBSE NET General Paper.
Check out the MCQs below to embark on an enriching journey through Data Interpretation. Test your knowledge, expand your horizons, and solidify your grasp on this vital area of UGC CBSE NET General Paper.
Note: Each MCQ comes with multiple answer choices. Select the most appropriate option and test your understanding of Data Interpretation. You can click on an option to test your knowledge before viewing the solution for a MCQ. Happy learning!
Data Interpretation MCQs | Page 1 of 14
Explore more Topics under UGC CBSE NET General Paper
Some of the cells have missing data. You might need to determine some of the missing data to answer the question below.
Which of the following could be the full marks in Mathematics if the pass marks in Mathematics was 35% and the person who just passed scored 70?

Some of the cells have missing data. You might need to determine some of the missing data to answer the question below.
What is the maximum mark that a student can score in all the five subjects together?

Some of the cells have missing data. You might need to determine some of the missing data to answer the question below.
What is the difference between the number of failed students in Science and the number of passed Social Studies?
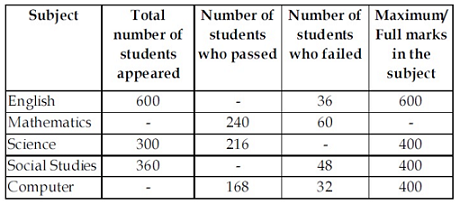
Some of the cells have missing data. You might need to determine some of the missing data to answer the question below.
What is the approximate difference in percentage between the pass % in Social Studies and the pass % in Mathematics?

Some of the cells have missing data. You might need to determine some of the missing data to answer the question below.
In which subject, was the failure percent the least?

The maximum decadal growth in population of India is registered in the period:

What was the per capita ownership of two wheelers in India in the year 2011?

What was the average decadal growth in the number of cars during 1961 – 2011?
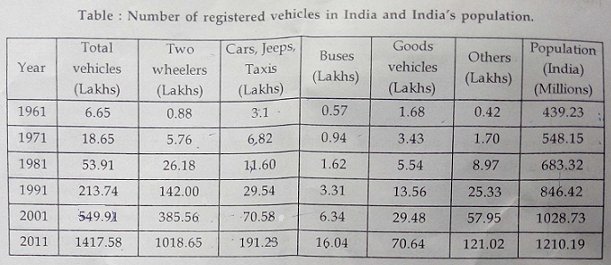
In which year the decadal growth (%) in number of cars surpassed that of the two wheelers?

In the year 2001, out of total number of vehicles, the number of passenger vehicles (4 wheelers) accounted for:

Suggested Topics
Are you eager to expand your knowledge beyond Data Interpretation? We've curated a selection of related categories that you might find intriguing.
Click on the categories below to discover a wealth of MCQs and enrich your understanding of Computer Science. Happy exploring!

.png)

Software Engineering
Learn about the systematic approach to developing software with our Software...

Operating System
Dive deep into the core of computers with our Operating System MCQs. Learn about...