Question
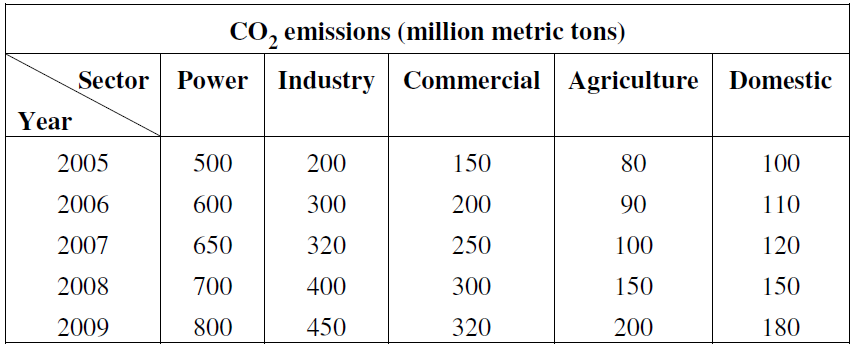
What is the average annual growth rate of CO2 emission in power sector?
a.
~12.57%
b.
~16.87%
c.
~30.81%
d.
~50.25%
Posted under UGC NET general paper Data Interpretation
Engage with the Community - Add Your Comment
Confused About the Answer? Ask for Details Here.
Know the Explanation? Add it Here.
Q. For a county CO2 emissions (million metric tons) from various sectors are given in the following table. Answer the question that follow on the basis of data given. What is the...
Similar Questions
Discover Related MCQs
Q. What is the percentage contribution of power sector to total CO2 emission in the year 2008?
View solution
Q. For a county CO2 emissions (million metric tons) from various sectors are given in the following table. Answer the question that follow on the basis of data given.
In which year, the contribution (%) of industry to total sectoral CO2 emission was minimum?
View solution
Q. For a county CO2 emissions (million metric tons) from various sectors are given in the following table. Answer the question that follow on the basis of data given.
What is the percentage (%) growth of CO2 emission from power sector during 2005 to 2009?
View solution
Q. For a county CO2 emissions (million metric tons) from various sectors are given in the following table. Answer the question that follow on the basis of data given.
Which sector has recorded maximum growth in CO2 emission during 2005 to 2009?
View solution
Q. Read the following table carefully. Based upon this table answer the question that follow:
Net Area under Irrigation by sources in a country (Thousand Hectares)
Find out the source of irrigation that has registered the maximum improvement in terms of percentage of Net irrigated area during 2002-03 and 2003-04.
View solution
Q. Read the following table carefully. Based upon this table answer the question that follow:
Net Area under Irrigation by sources in a country (Thousand Hectares)
In which of the following years, Net irrigation by tanks increased at the highest rate?
View solution
Q. Read the following table carefully. Based upon this table answer the question that follow:
Net Area under Irrigation by sources in a country (Thousand Hectares)
Identify the source of irrigation that has recorded the maximum incidence of negative growth in terms of Net irrigated area during the years given in the table.
View solution
Q. Read the following table carefully. Based upon this table answer the question that follow:
Net Area under Irrigation by sources in a country (Thousand Hectares)
In which of the following years, share of the tube wells and other wells in the total net irrigated area was the highest?
View solution
Q. Read the following table carefully. Based upon this table answer the question that follow:
Net Area under Irrigation by sources in a country (Thousand Hectares)
Which of the following sources of Irrigation has registered the largest percentage of decline in Net area under irrigation during 1997-98 and 2005-06 ?
View solution
Q. Following table provides details about the Foreign Tourist Arrivals (FTAs) in India from different regions of the world in different years. Study the table carefully and answer the below question based on this table.
Find out the region that contributed around 20 percent of the total foreign tourist arrivals in India in 2009.
View solution
Q. Following table provides details about the Foreign Tourist Arrivals (FTAs) in India from different regions of the world in different years. Study the table carefully and answer the below question based on this table.
Which of the following regions has recorded the highest negative growth rate of foreign tourist arrivals in India in 2009 ?
View solution
Q. Following table provides details about the Foreign Tourist Arrivals (FTAs) in India from different regions of the world in different years. Study the table carefully and answer the below question based on this table.
Find out the region that has been showing declining trend in terms of share of foreign tourist arrivals in India in 2008 and 2009.
View solution
Q. Following table provides details about the Foreign Tourist Arrivals (FTAs) in India from different regions of the world in different years. Study the table carefully and answer the below question based on this table.
Identify the region that has shown hyper growth rate of foreign tourist arrivals than the growth rate of the total FTAs in India in 2008.
View solution
Q. In the following table, trends in production of energy in India by primary sources are given. Study the table and answer Question that given below: (Production in peta Joules)
In which year primary sources recorded the lowest growth in total production of energy ?
View solution
Q. In the following table, trends in production of energy in India by primary sources are given. Study the table and answer Question that given below: (Production in peta Joules)
Which source of energy has shown the highest growth rate in production during 2006-07 to 2010-11 ?
View solution
Q. In the following table, trends in production of energy in India by primary sources are given. Study the table and answer Question that given below: (Production in peta Joules)
Which one of the following primary sources of energy has recorded the highest growth in production in 2008–09 ?
View solution
Q. In which year, production of hydro and nuclear electricity was almost double the production of crude petroleum and natural gas taken together ?
View solution
Q. Read the table below and based on this table answer the following question:
Which of the following two years have recorded the highest rate of increase in area under the total horticulture?
View solution
Q. Read the table below and based on this table answer the following question:
Shares of the area under flowers, vegetables and fruits in the area under total horticulture are respectively:
View solution
Q. Read the table below and based on this table answer the following question:
Which of the following has recorded the highest rate of increase in are during 2005-06 to 2009-10?
View solution
Suggested Topics
Are you eager to expand your knowledge beyond Data Interpretation? We've curated a selection of related categories that you might find intriguing.
Click on the categories below to discover a wealth of MCQs and enrich your understanding of Computer Science. Happy exploring!