Question
a.
reduce the gap between linearly spaced elements of the dependent variable t
b.
reduce the gap between elements of the dependent variable t
c.
increase the gap between linearly spaced elements of the dependent variable t
d.
increase the gap between elements of the dependent variable t
Posted under MATLAB
Engage with the Community - Add Your Comment
Confused About the Answer? Ask for Details Here.
Know the Explanation? Add it Here.
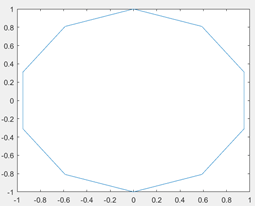
Q. How can we smoothen the following graph of sin (t) and cos (t) into a circle?
Similar Questions
Discover Related MCQs
Q. Which command gives a title to the graph plotted by MATLAB?
View solution
Q. Which command enables a title for the x-axis?
View solution
Q. Which command enables a title for the y-axis?
View solution
Q. How can several graphs for the same function be plotted on the same window?
View solution
Q. What is the slope of the sawtooth waveform generated by the sawtooth command?
View solution
Q. What is the period of the sawtooth() waveform which is generated by the sawtooth() command?
View solution
Q. The command used to generate an array of arrows is ________
View solution
Q. The period of sinusoidal curves can be changed in MATLAB.
View solution
Q. The command to draw the nature of a function over a default fundamental period is _________
View solution
Q. The limits of the axes drawn are only specified in the command used to plot the graph itself.
View solution
Q. Which command is suitable to change the axes of the graph plotted?
View solution
Q. Which command can be used to generate multiple graphs in the same window?
View solution
Q. Inline functions can be plotted by the _________ command.
View solution
Q. Which toolbox provides the plot command?
View solution
Q. A power pattern for an antenna is a __________
View solution
Q. The general graph of f(a,b)=0 is plotted by ______
View solution
Q. What is the period of square wave generated by the square() command?
View solution
Q. In a 2-d Plot, which command will make the axes of the graph same?
View solution
Q. What is the default range used by the fplot command?
View solution
Q. How can we group the elements in a 3-d bar graph?
View solution
Suggested Topics
Are you eager to expand your knowledge beyond MATLAB? We've curated a selection of related categories that you might find intriguing.
Click on the categories below to discover a wealth of MCQs and enrich your understanding of Computer Science. Happy exploring!


.png)